
On November 21, the FIFA World Cup in Qatar kicked off. This World Cup has created many historical records:
It is the first time held in the Northern Hemisphere's winter;
It is the first time hosted by a country that has never qualified for the World Cup finals;
It broke the host nation's unbeaten record in their opening match;
Saudi Arabia produced the biggest upset, defeating Argentina 2-1;
Germany lost 1-2 to Japan, marking another victory for Asian teams;
...
No wonder netizens commented that Qatar seems to be acting as a very new kind of host.
01
Can Qatar Become the First "Carbon Neutral" World Cup?
Besides the matches themselves, another issue has also garnered much attention: whether the Qatar World Cup can become the first "carbon neutral" World Cup as promised by the organizing committee?
In 2021, FIFA released the Qatar World Cup Greenhouse Gas Inventory Report. The report estimates that the total greenhouse gas emissions for the Qatar World Cup during the preparation, tournament, and post-tournament phases from April 2011 to June 2023 would be approximately 3.63 million tons of CO2 equivalent. To achieve "carbon neutrality," these 3.63 million tons of CO2 emissions must be offset. Therefore, the organizers have taken various measures to reduce the tournament's carbon emissions and actively implemented carbon offset measures.
First, during the preparation phase, Qatar took a series of measures to reduce carbon emissions:
· The main stadium, Lusail Stadium, adopted multiple environmental protection and energy-saving technologies and extensively used recyclable materials;
· One of the eight stadiums hosting the tournament, Al Janoub Stadium, was built from shipping containers and became the first fully dismantlable stadium in international sports history;
· During the tournament, electric vehicles were used for transportation, and waste from catering areas was composted or converted into green energy.
Furthermore, Qatar has actively taken carbon offset measures. On one hand, Qatar has pledged to purchase 1.8 million carbon credits from the Global Carbon Council (GCC), with each credit representing one ton of CO2. On the other hand, thanks to its renewable energy attributes and abundant sunlight, Qatar's first photovoltaic power plant will also contribute to the carbon reduction of the World Cup. The Supreme Committee for Delivery & Legacy (SC) of Qatar announced that the carbon savings from the 800.15 MW Al Kharsaah Solar Power Plant will be used to offset about half of the carbon emissions generated by this World Cup.
Through these series of carbon reduction measures, the Qatar World Cup is very likely to become the first "carbon neutral" World Cup. So, how is the carbon footprint of a World Cup calculated?
02
Decomposition of Qatar World Cup Carbon Emissions Pathway
Without quantification, there can be no management, and without management, there can be no carbon neutrality. Only by clearly quantifying the entire tournament's carbon emissions data can targeted emission reduction points be identified in different stages and emission reduction actions be carried out. Based on the Qatar World Cup Greenhouse Gas Inventory Report, we have decomposed the calculation pathway for the Qatar World Cup's carbon emissions.
Firstly, the time span. The entire reporting period is divided into three phases according to the tournament process: preparation phase, tournament phase, and post-tournament phase.
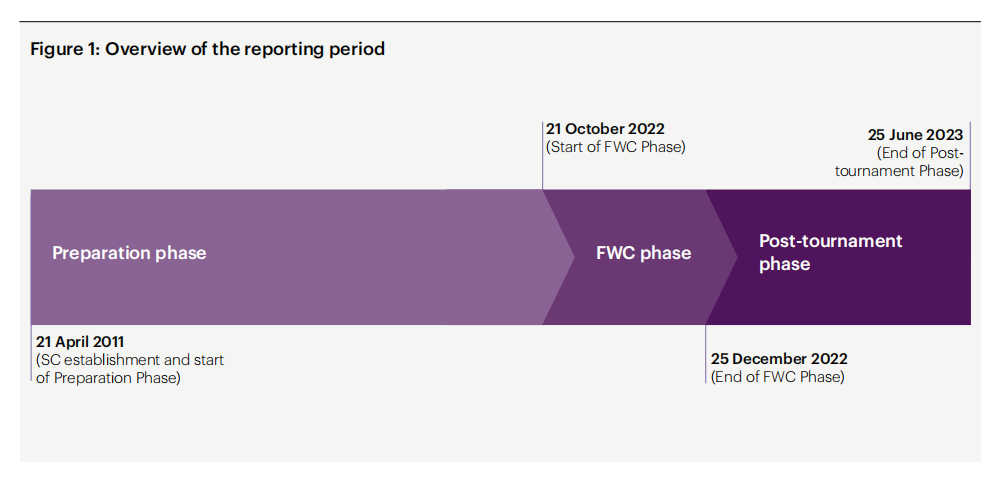
The preparation phase began on April 21, 2011, shortly after Qatar won the right to host the World Cup, and continued until October 20, 2022, one month before the start of the tournament. The tournament phase covers the entire duration of the World Cup, from when participating teams and relevant personnel arrive in Qatar until they leave. The post-tournament phase extends from the end of the tournament phase to June 25, 2023, mainly involving the dismantling of temporary structures and post-tournament logistics.
In other words, the time range for calculating the carbon emissions of the Qatar World Cup spans over 10 years, not just the emissions during the one-month tournament period.
Secondly, the organizational boundary for this tournament's inventory uses the operational control method. Operational control refers to an entity having operational control and the ability to execute and influence operational strategies.
From the perspective of FIFA and the host Qatar, although they do not have financial control over all activities, they have influence over all operations. Therefore, choosing the operational control method is more conducive to data inventory.
Finally, the reference standard for this tournament's greenhouse gas inventory is the GHG Protocol (Greenhouse Gas Protocol). Activity data includes actual data and estimated data from the preparation phase. Data from 2019 to 2023 are estimated based on data from the 2014 Brazil World Cup and the 2018 Russia World Cup. Emission factors follow the "conservative principle" and mostly come from sources such as Ecoinvent, BEIS, and IEA.
Ultimately, the emission data obtained are: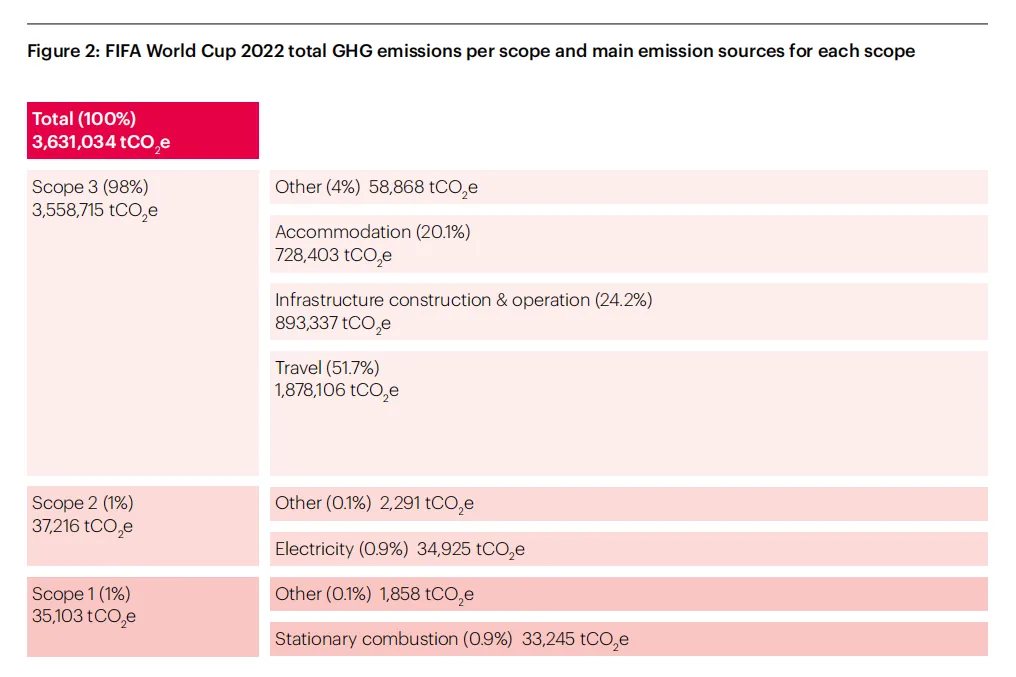
· 98% of the tournament's emissions come from Scope 3, while Scope 1 and Scope 2 each account for 1% of total emissions.
· Travel emissions account for 51.7% of all emissions, almost entirely due to international air travel, while accommodation emissions account for 20.1% of total emissions.
· Infrastructure construction emissions account for 24.6% of all emissions, with permanent venues accounting for 17.6% of total emissions.
03
How Much Carbon Footprint Does a Match Generate?
First, identify the emission sources, which mainly include:
- Electricity emissions from stadium lighting, sound systems, large screens, cooling, etc.;
- Fossil fuel combustion emissions from stadium power generation;
- Transportation and accommodation emissions from teams, referees, and related staff;
- Transportation and accommodation emissions from fans attending matches;
- Indirect emissions from fans purchasing water, food, beverages, printed materials, etc., inside the stadium;
- Emissions from waste management during the tournament.
Next, we calculate based on the data disclosed in the Qatar World Cup Greenhouse Gas Inventory Report.
The venue for this match is the Al Bayt Stadium, which can accommodate over 60,000 spectators. The stadium's electricity comes from the power grid and on-site temporary diesel generators,generating about 500 tons of CO2 equivalent per day of operation.
As a highlight match, this game is expected to be fully attended,with an estimated 60,000 spectators.
According to the organizing committee, 60% of the spectators come from outside Qatar and GCC (Gulf Cooperation Council) countries and will travel by air,with an average flight distance of about 6,580 km; while 26% of local Qatari spectators will travel by road.
Additionally, among GCC country spectators, 64% will travel by air, and 36% by road. For intra-city transportation, the average travel distance per spectator is 63 km, with the proportion of bus, subway, and car use being 40%, 30%, and 30%, respectively.
Notably, on average, each spectator holds three tickets, so the carbon emissions for watching a single match need to be divided by 3 to accurately reflect the emissions per match.
Based on the above,we can estimate that the travel emissions for spectators watching the England vs. USA match amount to about 18,000 tons of CO2 equivalent.
Moreover, on average, each spectator stays in Qatar for six nights, mostly in 2-star or 3-star hotels, resulting inabout 10,000 tons of CO2 equivalent in accommodation emissions per match.
In addition, indirect carbon emissions from spectators purchasing water, food, and souvenirs inside the stadium are estimated atabout 300 tons of CO2 equivalent, and waste management generatesabout 30 tons of CO2 equivalent. Travel, accommodation, and catering emissions for players, delegations, and referees are estimated atabout 20 tons of CO2 equivalent.
In summary, the total emissions for the England vs. USA match are approximately 29,000 tons of CO2 equivalent, suggesting that the carbon footprint for a World Cup match is roughly 29,000 tons.Of course, the importance and popularity of each match vary, so there may be some differences in actual emissions.

04
Summary
As an international sporting event, the Qatar World Cup generates carbon emissions measured in millions of tons, making it difficult to achieve "carbon neutrality." However,Qatar has actively taken various emission reduction measures,and after exhausting all possible reductions, offsets emissions through methods such as purchasing credits,demonstrating a firm commitment to green transformation and serving as a significant demonstration for achieving global "double carbon" targets.
Under the mission of "double carbon," holding "carbon-neutral" events or meetings will become an increasingly popular choice for more businesses and individuals. For companies, it can communicate corporate values to society and build a low-carbon corporate image; for individuals, it can demonstrate a sense of social responsibility and actively contribute to curbing global climate change.
In 2014, Carbonstop collaborated with the United Nations Environment Programme to complete the writing of the Green Meeting Guidelines and Actions, serving as an implementation guide for green meetings.The core of green meetings is to advocate hosting meetings in a sustainable manner, continuously reducing greenhouse gas emissions throughout the meeting process, and ultimately achieving "carbon neutrality" for the meeting.
In executing green meeting projects over the years, Carbonstop has strictly adhered to the guidelines to provide green meeting services to clients.We are professional in providing green and low-carbon suggestions, conducting carbon accounting, issuing carbon emission reports, and awarding green meeting certificates. If you need any assistance, please feel free to contact our assistant at the end of the article.


